The debt to equity ratio (D/E ratio) measures the proportion of a company’s financing that comes from debt versus equity. It tells you how leveraged a company is—how much it relies on borrowed money compared to its own funds. A high D/E ratio often suggests that a company has been aggressive in financing its growth with debt, which can result in volatile earnings as a result of the additional interest expense.
Formula:
> Debt to Equity Ratio = Total Liabilities / Shareholders’ Equity
Both figures come directly from the balance sheet.
Quick Example
A company has:
- Total Liabilities: $600,000
- Shareholders’ Equity: $400,000
D/E Ratio = $600,000 / $400,000 = 1.5
This means for every $1 of equity, the company carries $1.50 of debt.
Interpreting the Ratio
|
D/E Ratio |
General Interpretation |
|---|---|
|
Below 0.5 |
Conservatively financed; low risk |
|
0.5 – 1.0 |
Balanced leverage; healthy for most industries |
|
1.0 – 2.0 |
Moderately leveraged; acceptable in many sectors |
|
Above 2.0 |
High leverage; higher risk; scrutinize cash flows |
|
Negative |
Equity is negative (liabilities exceed assets) – serious concern |
Industry Context Matters Enormously
The D/E ratio means very different things in different sectors. Capital-intensive industries with stable cash flows routinely operate with high debt loads – this is normal and healthy in their context.
|
Industry |
Typical D/E Ratio |
Why |
|---|---|---|
|
Banking / Financial |
10x-20x |
Deposits = liabilities; fundamental to the model |
|
Utilities |
1.5x-3.0x |
Stable cash flows support high leverage |
|
Real estate |
1.5x-3.0x |
Property assets financed by mortgages |
|
Manufacturing |
0.5x-1.5x |
Mixed; depends on capital intensity |
|
Technology |
0.1x-0.5x |
High margins; often debt-free or low debt |
|
Retail |
0.5x-1.5x |
Variable; e-commerce vs. brick-and-mortar differ |
|
Airlines |
2.0x-5.0x |
Aircraft financing drives high leverage |
Never compare D/E ratios across industries. A 2.0 ratio is normal for a utility but alarming for a tech startup.
What Investors Look For
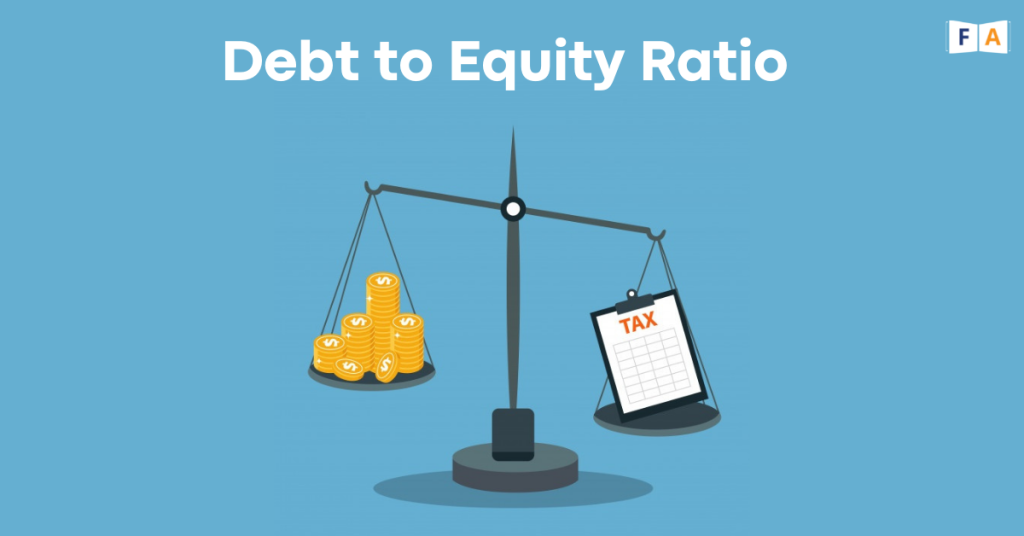
High D/E (high leverage):
- Amplifies returns when business does well
- Amplifies losses when business suffers
- Higher interest expense reduces profits
- Greater risk of financial distress in downturns
Low D/E (low leverage):
- More financial flexibility
- Better positioned to survive recessions
- May be missing growth opportunities (debt can be productive)
- Attractive to risk-averse investors
Long-Term vs Short-Term Debt
Not all debt is the same. Some analysts use only long-term debt in the numerator rather than total liabilities, since short-term liabilities (accounts payable, accrued expenses) are part of normal operations, not financial leverage.
Long-Term D/E = Long-Term Debt / Shareholders’ Equity
This version is often more relevant for assessing financial risk from borrowed capital specifically.
Trend Analysis: More Important Than a Single Number
Looking at D/E ratio over time tells a richer story than a single snapshot:
- Rising D/E: Company is taking on more debt – may signal growth investment or financial strain
- Falling D/E: Paying down debt or growing equity through retained earnings – generally positive
- Stable D/E: Consistent capital structure; predictable leverage
The Bottom Line
The debt to equity ratio is a fundamental measure of financial leverage and risk. A ratio that looks high in isolation might be perfectly normal for the industry. Always compare within the same sector, track trends over time, and pair it with profitability and cash flow metrics for a complete picture.